La Nina Cooling Insufficient To Neutralize Human Induced Climate Warming


El Niño and La Niña events have become more frequent in the last two decades or so. Between 2011 and 2025, the ENSO events have been nearly equally distributed. While El Niño occurred in 2014, 2015, 2019, and 2023, the La Niña episodes appeared in 2016, 2020, 2021, 2022, and 2024. The ongoing trend may capture La Niña in 2025 as well, though the event is likely to be brief and weak, resembling 2024.

The atmosphere warms more during El Niño and less during La Niña, affecting global average temperatures. As per the study, for every degree Celsius of El Niño warming in the Central-Equatorial Pacific, particularly in the Nino 3.4 region, the global average surface temperature rises by 0.07°C. Similarly, for a 1°C cooling during La Niña, the global average surface temperature drops by a similar margin. Though the variation seems marginal, it involves huge heat transfer between the ocean and atmosphere, influencing the entire globe. Water has a long memory and is slow to heat up and cool down; thus, the rise and fall of ocean temperature during El Niño and La Niña affect the global average surface temperature with a delay of a few months.

Despite the increase in La Niña events, including the triple-dip La Niña of 2010–11–12 and 2020–21–22, global cooling could not offset global warming caused by greenhouse gas emissions and human-induced climate change. La Niña cannot compensate for the high level of global warming. There is evidence that the global average temperature during recent La Niña years was warmer than during El Niño years in earlier decades. The La Niña year of 2020 tied with 2016, which began with a major El Niño, as the all-time record-high global surface temperature. The year 2016 has now been overtaken by 2023 and 2024 as the hottest years.
ENSO: Sea Surface Temperature (SST) in the Pacific Ocean is measured using a combination of in-situ instruments like buoys and ships and remote sensing from satellites. Every day, instruments on satellites in two different orbits (geostationary and polar) measure SSTs by checking how much energy is radiated by the ocean at different wavelengths. Satellites use radiometers to measure the skin temperature of the ocean surface, while buoys and ships provide direct measurements from the top few meters. This data is used for weather forecasting, climate monitoring, and understanding ocean dynamics.

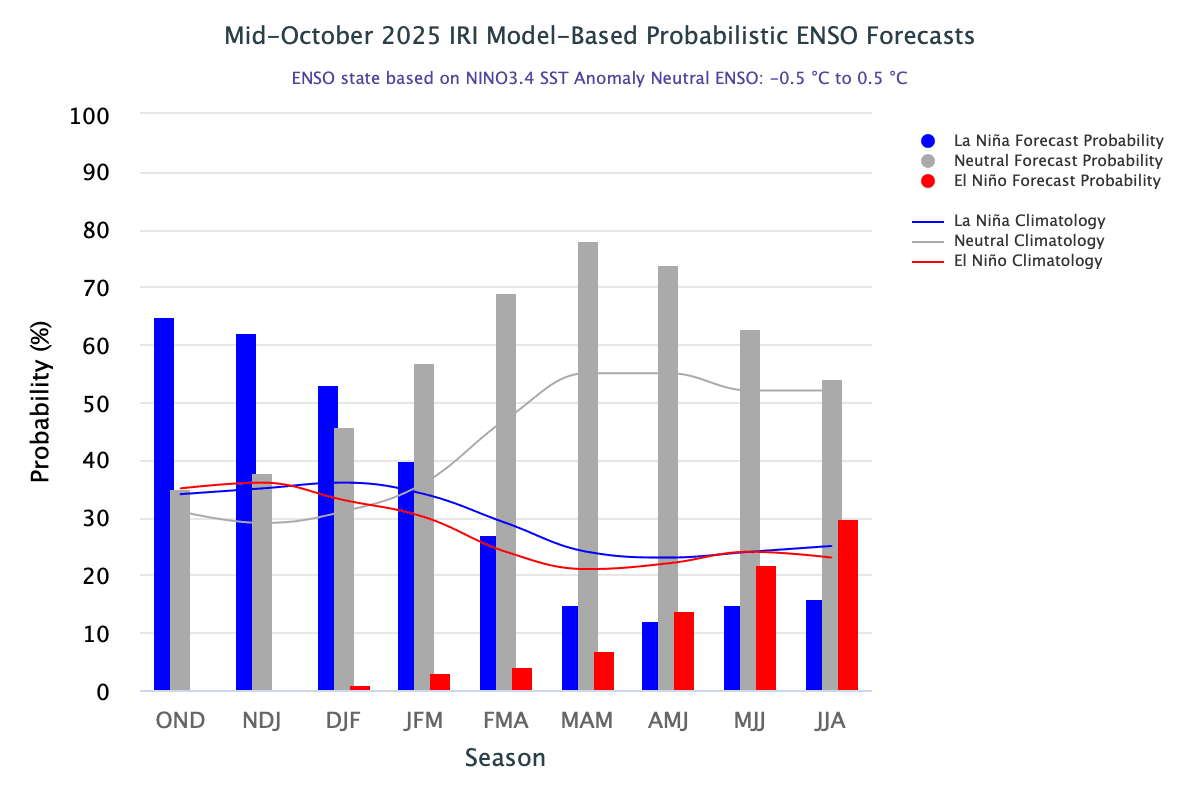
The Oceanic Nino Index (ONI) is based on SST departure from the average in the Nino 3.4 region and is a principal measure for monitoring, assessing, and predicting ENSO. The ONI was below the threshold mark of -0.5°C at the start of 2025 and has remained negative throughout this year. It reached the lowest mark of -0.1°C for the seasons MAM-AMJ-MJJ. There has been a steady drop once again from the quarter Jun-Jul-Aug. As per preliminary estimates, it has reached a value of -0.4°C for the season Aug-Sep-Oct. The official reading is yet to arrive, but it is still short of the magic mark of -0.5°C for the start of La Niña. The temperature anomaly in the Nino 3.4 region has consistently remained at -0.6°C for the last three weeks. Subject to the continuation of this trend for November 2025, the ONI will reach a borderline case of -0.5°C for the season Sep-Oct-Nov. This will facilitate the commencement of La Niña conditions, yet this stage needs to be qualified further for at least three consecutive overlapping three-month seasons.
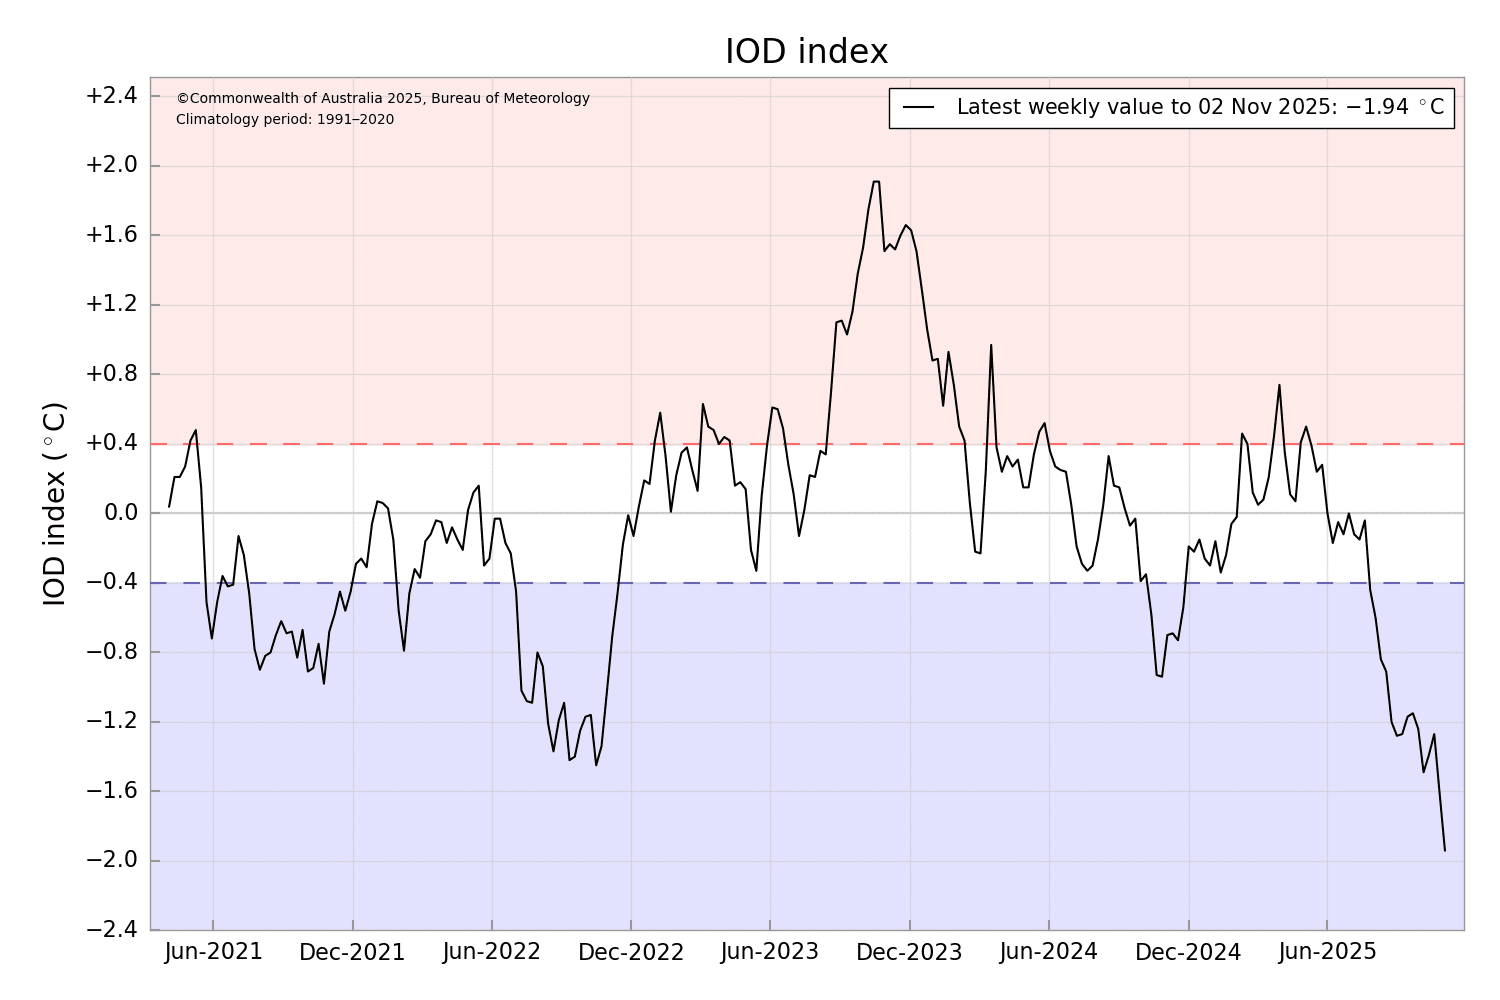
IOD: A negative Indian Ocean Dipole event continues. However, the IOD index has risen, breaching the -1.94°C mark for the first time after ten weeks. This could be a transient spike, as often happens at this time of the year. The temperature is likely to fall again. The forecast from November to January shows warmer-than-average SSTs over the eastern bloc of the Indian Ocean and cooler SSTs over the western equatorial Indian Ocean.
MJO: The Madden-Julian Oscillation was interacting favourably so far with the evolving La Niña conditions to enhance convection across the Western Maritime Continent. The South China Sea and Western Pacific remained active basins. A strong typhoon, Kalmaegi, battered the Philippines and the Pacific Ring countries of East Asia. Another storm is heading for the northern parts of the Philippines. The MJO will propagate eastward and sail over the Western Pacific in Phases 5 and 6, with its amplitude likely to flare up in the second half of November.
The remnants of Typhoon Kalmaegi are likely to enter the East-Central Bay of Bengal anytime soon. It may merge with the pre-existing cyclonic circulation over the same region. It’s early to say, but the merger may trigger fresh cyclogenesis over the equatorial region of the Bay of Bengal. The area needs to remain under close watch for any development.
Trending: Delhi Air Quality Worsens Sharply in October; Dharuhera Tops List of India’s Most Polluted Cities
Skymet is India’s most accurate private weather forecasting and climate intelligence company, providing reliable weather data, monsoon updates, and agri-risk management solutions across the country.